Center Wavelength(nm) To:From: | Typical 3dB Bandwidth(nm) To:From: | Typical Output Power(mW) To:From: | Typical Ripple(dB) | Typical Current To:From: | Package Type | Part Number |
|---|---|---|---|---|---|---|
| Center Wavelength(nm) | Typical 3dB Bandwidth(nm) | Typical Output Power(mW) | Typical Ripple(dB) | Typical Current | Package Type | Part Number |
| 750 | 10 | 3 | 0.1 | 120 | BUT or DIL |  IPSDD0701 IPSDD0701 |
| 750 | 14 | 10 | 0.1 | 120 | TO 8, 9 or 56 Ex-Window |  IPSDT0701 IPSDT0701 |
| 770 | 13 | 8 | 0.1 | 180 | BUT or DIL | IPSDD0705 |
| 770 | 20 | 5 | 0.1 | 140 | BUT or DIL | IPSDD0706 |
| 780 | 12 | 3 | 0.1 | 150 | BUT or DIL | IPSDD0702 |
| 780 | 12 | 10 | 0.1 | 180 | BUT or DIL | IPSDD0707 |
| 780 | 40 | 5 | 0.1 | 200 | BUT or DIL | IPSDD0708 |
| 800 | 10 | 15 | 0.1 | 200 | BUT or DIL | IPSDD0809 |
| 800 | 40 | 5 | 0.1 | 200 | BUT or DIL | IPSDD0810 |
| 820 | 15 | 0.3 | 0.1 | 120 | BUT or DIL | IPSDD0801 |
| 820 | 15 | 5 | 0.1 | 120 | TO 8, 9 or 56 Ex-Window | IPSDT0801 |
| 820 | 15 | 8 | 0.1 | 140 | TO 8, 9 or 56 Ex-Window | IPSDT0802 |
| 820 | 25 | 2.5 | 0.1 | 140 | BUT or DIL | IPSDD0802 |
| 820 | 25 | 8 | 0.1 | 140 | TO 8, 9 or 56 Ex-Window | IPSDT0803 |
| 820 | 40 | 5 | 0.1 | 180 | BUT or DIL | IPSDD0803 |
| 820 | 85 | 7.5 | 0.15 | 600 | BUT | IPSDD0811 |
| 830 | 30 | 15 | 0.2 | 200 | BUT or DIL | IPSDD0820 |
| 830 | 32 | 45 | 0.1 | 250 | TO 8, 9 or 56 Ex-Window | IPSDT0804 |
| 830 | 40 | 7 | 0.1 | 200 | BUT or DIL | IPSDD0812 |
| 830 | 40 | 10 | 0.1 | 150 | TO 8, 9 or 56 Ex-Window | IPSDT0805 |
| 830 | 50 | 5 | 0.1 | 150 | BUT or DIL | IPSDD0813 |
| 830 | 150 | 12 | 0.15 | 600 | BUT | IPSDD08XX |
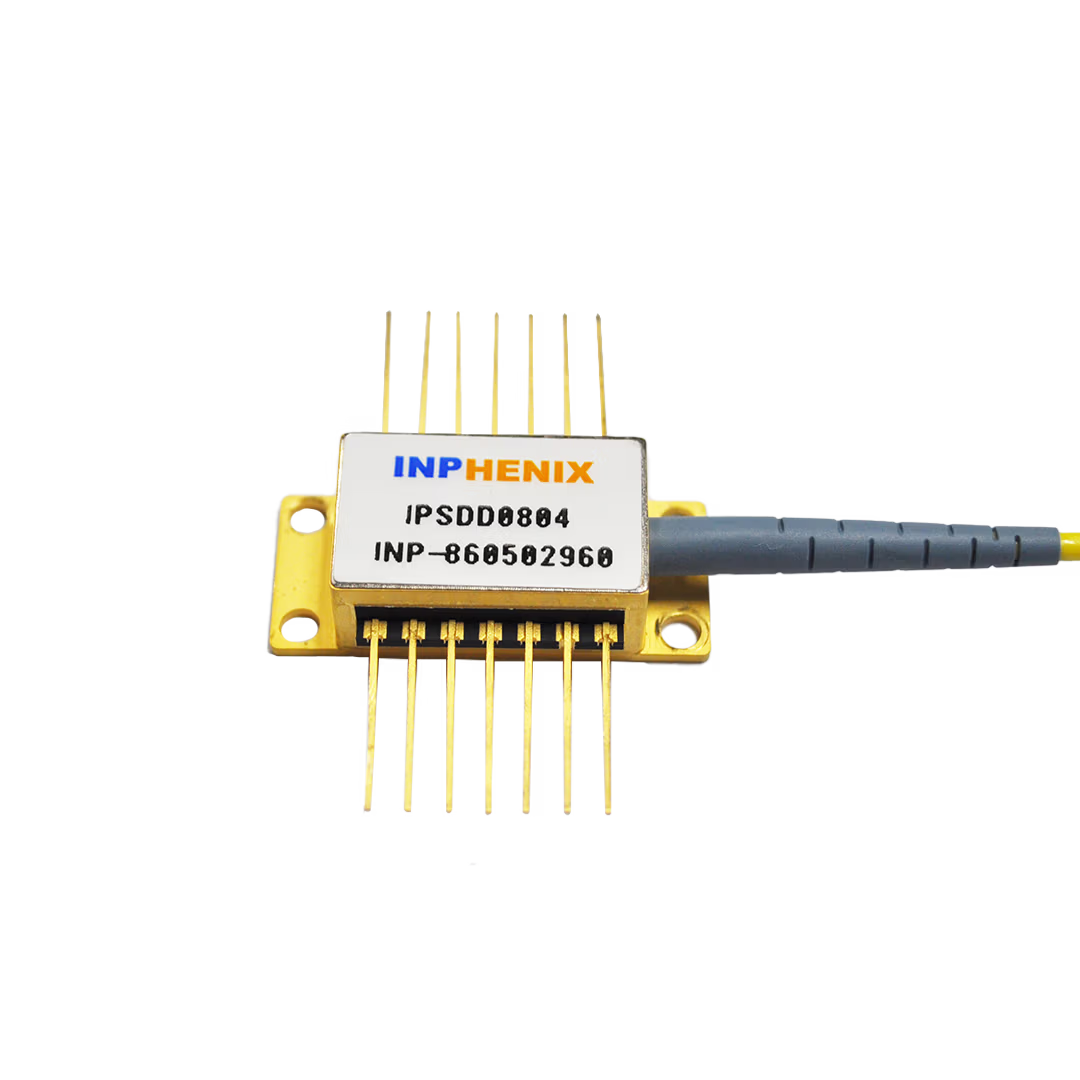
| 840 | 35 | 5 | 0.1 | 160 | BUT or DIL | IPSDD0804 |
| 840 | 45 | 8 | 0.1 | 200 | BUT or DIL | IPSDD0807 |
| 840 | 45 | 11 | 0.1 | 250 | BUT or DIL | IPSDD0808 |
| 840 | 50 | 8 | 0.1 | 200 | BUT or DIL | IPSDD0823 |
| 840 | 75 | 10 | 0.15 | 600 | BUT | IPSDD08XX |
| 850 | 50 | 8 | 0.1 | 200 | BUT or DIL | IPSDD0815 |
| 850 | 130 | 12 | 0.15 | 600 | BUT | IPSDD08XX |
| 870 | 50 | 6 | 0.1 | 180 | BUT or DIL | IPSDD0816 |
| 870 | 90 | 10 | 0.15 | 600 | BUT | IPSDD08XX |
| 880 | 45 | 6 | 0.1 | 200 | BUT or DIL | IPSDD0805 |
| 880 | 40 | 2 | 0.1 | 180 | BUT or DIL | IPSDD0806 |
| 880 | 45 | 8 | 0.1 | 180 | BUT or DIL | IPSDD0819 |
| 880 | 55 | 5 | 0.1 | 180 | BUT or DIL | IPSDD0817 |
| 900 | 15 | 20 | 0.2 | 200 | BUT or DIL | IPSDD0902 |
| 900 | 15 | 35 | 0.2 | 200 | TO 8 or 9 Ex-Window | IPSDT0901 |
| 900 | 30 | 10 | 0.1 | 200 | TO 8 or 9 Ex-Window | IPSDT0902 |
| 900 | 45 | 7 | 0.1 | 200 | BUT or DIL | IPSDD0903 |
| 920 | 30 | 3 | 0.1 | 150 | BUT or DIL | IPSDD0901 |
| 920 | 55 | 8 | 0.1 | 200 | BUT or DIL | IPSDD0904 |
| 920 | 90 | 5 | 0.1 | 200 | BUT or DIL | IPSDD0905 |
| 980 | 25 | 5 | 0.1 | 250 | BUT or DIL | IPSDD0906 |
| 1020 | 100 | 10 | 0.15 | 250 | BUT or DIL | IPSDD1001 |
| 1020 | 60 | 7 | 0.1 | 150 | BUT or DIL | IPSDD1005 |
| 1020 | 110 | 8 | 0.1 | 300 | BUT or DIL | IPSDD1006 |
| 1040 | 55 | 30 | 0.2 | 400 | BUT or DIL | IPSDD1007 |
| 1040 | 70 | 10 | 0.1 | 250 | BUT or DIL | IPSDD1002 |
| 1050 | 45 | 35 | 0.2 | 400 | BUT or DIL | IPSDD1008 |
| 1050 | 55 | 15 | 0.1 | 300 | BUT or DIL | IPSDD1009 |
| 1050 | 55 | 30 | 0.1 | 400 | BUT or DIL | IPSDD1003 |
| 1070 | 60 | 5 | 0.1 | 500 | BUT or DIL | IPSDD1010 |
| 1070 | 60 | 10 | 0.15 | 400 | BUT or DIL | IPSDD1004 |
| 1280 | 55 | 10 | 0.5 | 350 | BUT or DIL | IPSDD1201 |
| 1280 | 70 | 5 | 0.15 | 300 | BUT or DIL | IPSDD1202 |
| 1280 | 95 | 10 | 0.5 | 500 | BUT or DIL | IPSDD1203 |
| 1310 | 40 | 1.5 | 0.1 | 120 | TO 8, 9 or 56 Ex-Window | IPSDT1301 |
| 1310 | 40 | 0.5 | 0.1 | 120 | TO 56 pigtail Ex-Fiber | IPSDT1303 |
| 1310 | 40 | 5 | 0.1 | 150 | TO 8, 9 or 56 Ex-Window | IPSDT1302 |
| 1310 | 40 | 35 | 1 | 400 | BUT or DIL | IPSDD1305 |
| 1310 | 45 | 1 | 0.1 | 120 | BUT or DIL | IPSDD1301 |
| 1310 | 45 | 20 | 1 | 350 | BUT or DIL | IPSDD1302 |
| 1310 | 45 | 25 | 1 | 350 | BUT or DIL | IPSDD1309 |
| 1310 | 50 | 15 | 0.2 | 150 | TO 8, 9 or 56 Ex-Window | IPSDT1310 |
| 1310 | 55 | 7 | 0.5 | 300 | BUT or DIL | IPSDD1303 |
| 1310 | 55 | 20 | 1 | 450 | BUT or DIL | IPSDD1304 |
| 1310 | 55 | 25 | 1 | 350 | BUT or DIL | IPSDD1311 |
| 1310 | 70 | 18 | 1 | 500 | BUT or DIL | IPSDD1306 |
| 1310 | 65 | 15 | 1 | 250 | BUT or DIL | IPSDD1312 |
| 1310 | 80 | 15 | 1 | 450 | BUT or DIL | IPSDD1307 |
| 1310 | 90 | 10 | 1 | 350 | BUT or DIL | IPSDD1313 |
| 1310 | 100 | 3 | 0.1 | 180 | BUT or DIL | IPSDD1308 |
| 1410 | 50 | 10 | 1 | 300 | BUT or DIL | IPSDD1401 |
| 1410 | 60 | 15 | 1 | 450 | BUT or DIL | IPSDD1402 |
| 1410 | 70 | 10 | 1 | 550 | BUT or DIL | IPSDD1403 |
| 1490 | 50 | 5 | 0.5 | 200 | BUT or DIL | IPSDD1404 |
| 1490 | 65 | 18 | 1 | 500 | BUT or DIL | IPSDD1405 |
| 1520 | 50 | 15 | 0.15 | 400 | BUT or DIL | IPSDD1505 |
| 1520 | 75 | 10 | 1 | 350 | BUT or DIL | IPSDD1506 |
| 1550 | 40 | 0.2 | 0.15 | 120 | TO 56 pigtail Ex-Fiber | IPSDT1501 |
| 1550 | 55 | 0.5 | 0.1 | 120 | BUT or DIL | IPSDD1501 |
| 1550 | 55 | 5 | 0.2 | 200 | BUT or DIL | IPSDD1502 |
| 1550 | 60 | 3 | 0.2 | 300 | BUT or DIL | IPSDD1503 |
| 1550 | 50 | 3 | 0.2 | 150 | TO 8, 9 or 56 Ex-Window | IPSDT1502 |
| 1550 | 60 | 10 | 1 | 300 | BUT or DIL | IPSDD1504 |
| 1550 | 65 | 12 | 0.15 | 300 | BUT or DIL | IPSDD1507 |
| 1550 | 65 | 20 | 0.4 | 450 | BUT or DIL | IPSDD1508 |
| 1550 | 90 | 8 | 1 | 300 | BUT or DIL | IPSDD1509 |
| 1580 | 60 | 5 | 0.2 | 300 | BUT or DIL | IPSDD1510 |
| 1580 | 75 | 5 | 0.4 | 300 | BUT or DIL | IPSDD1511 |
| 1610 | 55 | 2 | 0.1 | 250 | BUT or DIL | IPSDD1601 |
| 1610 | 65 | 5 | 0.5 | 250 | BUT or DIL | IPSDD1602 |
| 1640 | 40 | 5 | 0.5 | 400 | BUT or DIL | IPSDD1603 |
| 1640 | 50 | 3 | 0.5 | 200 | BUT or DIL | IPSDD1604 |
1. Optical Coherence Tomography (OCT) with Superluminescent Diode Device (SLD)
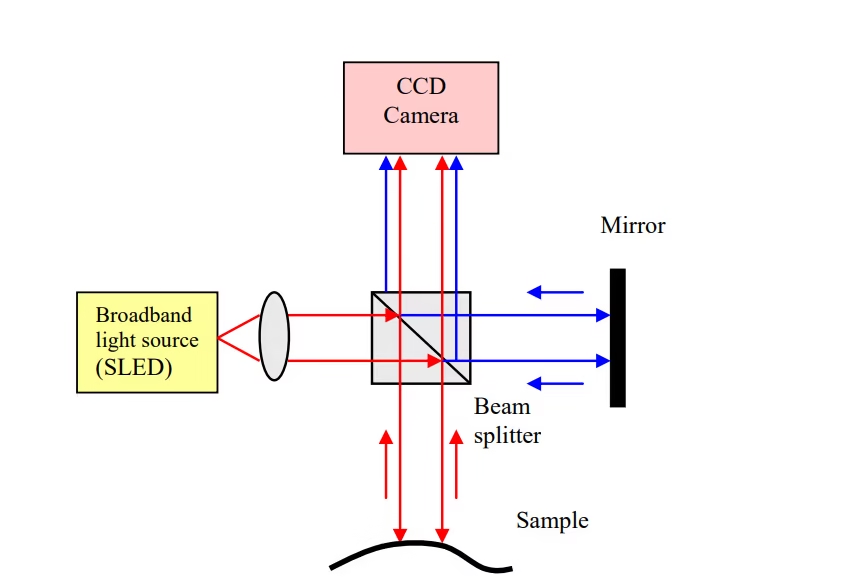
Optical Coherence Tomography (OCT) is a powerful optical signal acquisition and processing method that utilizes superluminscent diode devices and interferometric techniques to capture micrometer-resolution, three-dimensional images from within scattering media, such as biological tissue. Superluminescent Diode Devices (SLDs), known for their role in amplified spontaneous emission, are extensively used as broad-band spectrum light sources covering a wide spectral range in OCT systems, often alongside LED technology for additional illumination. Their very wide-spectrum emission, resulting from superluminescence phenomena, sometimes over a ~145 nm wavelength range, has enabled sub-micrometer resolution imaging. OCT typically employs near-infrared light, and the use of the relatively long wavelength emitted by Superluminescent Diode Devices (SLDs) allows for deeper penetration into scattering mediums.
Commercially available OCT systems, powered by Superluminescent Diode Devices (SLDs), provide high output power and are employed in diverse applications. These include art conservation and diagnostic medicine, particularly in ophthalmology for obtaining detailed retinal images, and increasingly in interventional cardiology for diagnosing coronary artery disease.
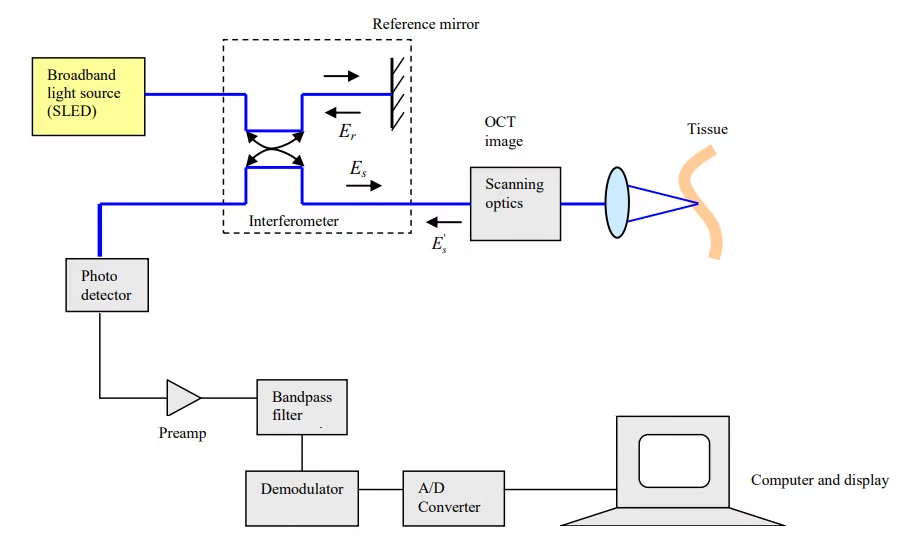
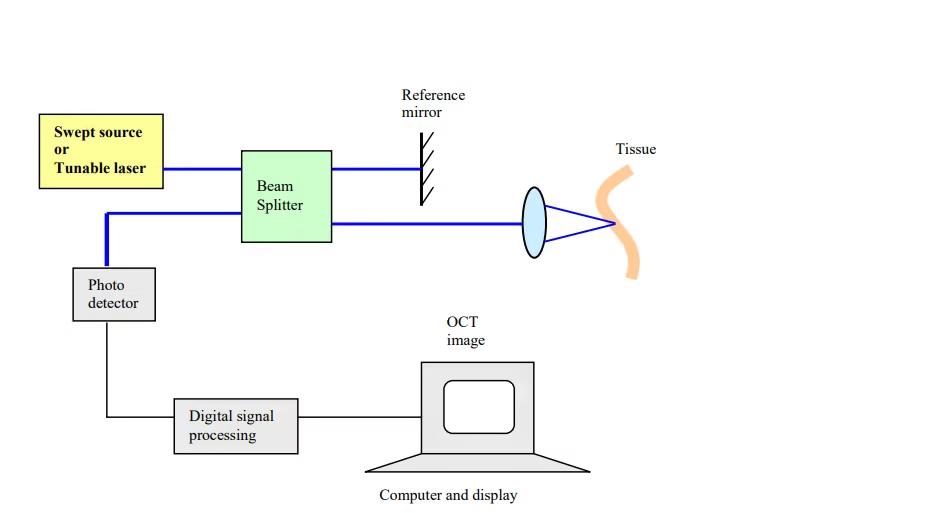
There are two primary types of OCT systems: Time-domain OCT and Frequency-domain OCT.
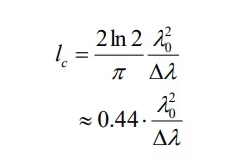
Time-domain OCT: In this configuration, light from the Superluminescent Diode Device (SLD) is split into a sample arm and a reference arm. An interference pattern is generated when reflected light from both arms recombines, but only if the optical path difference is less than the coherence length of the light source. By scanning a mirror in the reference arm, a reflectivity profile of the sample is obtained. The axial resolution of OCT, directly equivalent to the coherence length of the Superluminescent Diode Device (SLD) source, is defined by: